Image Details
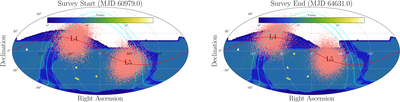
Caption: Figure 7.
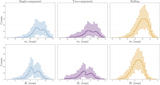
Sky coverage of an entire input intrinsic NT orbital model (pink scatter points) at the beginning of the survey (left) vs. at the end of the survey (right) showing the bulk movement of the underlying clouds. In both projections, the L4 cloud is labeled on the left, whereas the L5 cloud is labeled on the right. The red solid line shows the ecliptic plane, and the light blue line the Galactic plane with dashed lines marking ±10° off of it.
Other Images in This Article
Copyright and Terms & Conditions
© 2026. The Author(s). Published by the American Astronomical Society.
Copyright ©
2026 Astronomy Image Explorer. All Rights Reserved.