Image Details
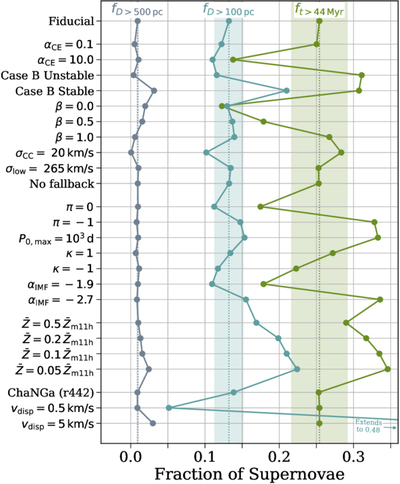
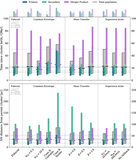
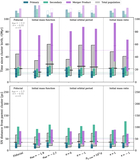
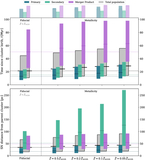
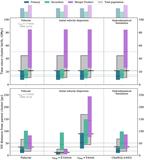
Caption: Figure 13.
The fraction of the total population in the tails of the SNe timing and distance distributions for each variation (variations are outlined in Section 4.1). Scatter points indicate the ft > 44 Myr (green), fD > 100 pc (light blue), and fD > 500 pc (slate blue) fractions. Note that 44 Myr is the assumed final core-collapse SN time in FIRE-3. Dotted lines and shaded regions show the fiducial value and a ±15% region around this value. The exact values for each variation are given in Table C1. An interactive version of this data is available in Figure 12.
Other Images in This Article
Show More
Copyright and Terms & Conditions
© 2025. The Author(s). Published by the American Astronomical Society.
Copyright ©
2025 Astronomy Image Explorer. All Rights Reserved.