Image Details
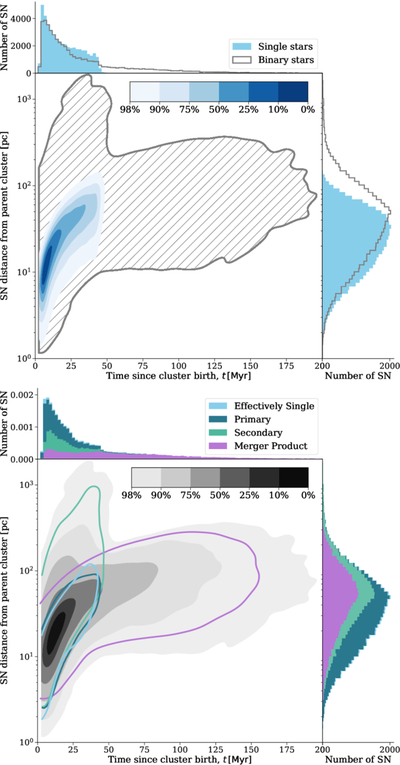
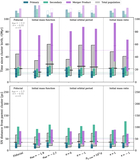
Caption: Figure 3.
Top panel: binary stars produce a significantly different distribution of SNe times and locations than single stars. The main panel shows a 2D kernel density estimation of the distribution of SNe for single star population in blue. The gray hatched contour shows the 98% region for a binary star population. Marginal histograms are shown in each side panel. Bottom panel: the timing and location of SNe relative to their parent cluster are strongly correlated and a function of their progenitor type. Gray filled contours show the full 2D density distribution, while colored contours indicate the region within which 90% of each subpopulation is contained. Marginal histograms are the same distributions as the top panels of Figure 1.
Other Images in This Article
Show More
Copyright and Terms & Conditions
© 2025. The Author(s). Published by the American Astronomical Society.