Image Details
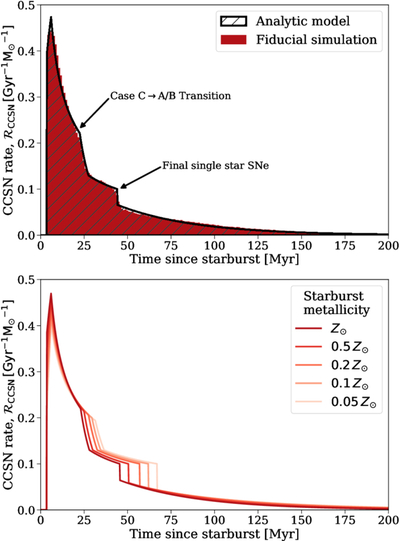
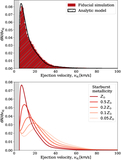
Caption: Figure 9.
Top panel: a comparison of our analytic model (Equation (2), shown in black) to the SNe delay time distribution to our fiducial simulation (shown in red). Transition points are annotated with the physical process driving them. The model reproduces the late SN rate and overall normalization to within 0.5%. Bottom panel: the metallicity dependence of our analytic model to the SN time distribution. Lower-metallicity star formation events produce more SNe that typically occur later. Our analytic model reproduces the late SNe rates and normalizations of our lower-metallicity simulations to within 1%. An interactive version of this figure (and Figure 10) is available. The interactive version allows the reader to change the metallicity and see the resulting changes to the analytic model.
An interactive version of this figure is available in the online article.
An interactive version of this figure is available.
An interactive version of this figure is available in the online journal.
Other Images in This Article
Show More
Copyright and Terms & Conditions
© 2025. The Author(s). Published by the American Astronomical Society.