Image Details

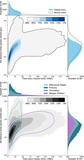
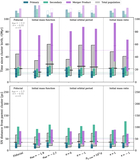
Caption: Figure 8.
The distribution of metallicities of stars in our fiducial m11h simulation, compared to those in the changar442 simulation with a factor of 2 increased metallicity. The boxes at the top indicate the interquartile range, with the median shown with a line in the box. As noted in Section 4.5, the average metallicity is very similar between the simulations, with a slight difference in the width of the distribution.
Other Images in This Article
Show More
Copyright and Terms & Conditions
© 2025. The Author(s). Published by the American Astronomical Society.
Copyright ©
2025 Astronomy Image Explorer. All Rights Reserved.