Image Details
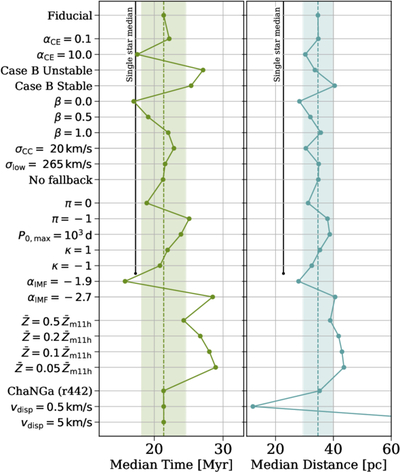
Caption: Figure 12.
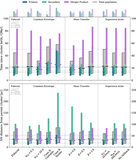
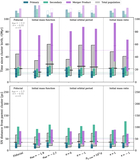
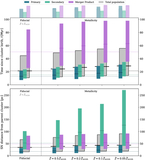
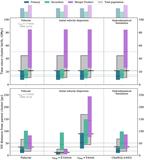
The median time and distance at which SNe occur for each variation (variations are outlined in Section 4.1). Dotted lines and shaded regions show the fiducial value and a ±15% region around this value. The solid black lines show the median value of a population of single stars equivalent to our fiducial model. The lines do not continue for all variations, since the later ones would alter a single star population as well. Given the extreme physics variations that we consider, the relatively small differences in these medians demonstrate an encouraging robustness of our results to uncertainties. The exact values for each variation are given in Table C2. An interactive version of this figure (and Figures 13–14) is available. The interactive version allows the reader to inspect specific model variations across Figures 12–14 simultaneously.
An interactive version of this figure is available in the online article.
An interactive version of this figure is available.
An interactive version of this figure is available in the online journal.
Other Images in This Article
Show More
Copyright and Terms & Conditions
© 2025. The Author(s). Published by the American Astronomical Society.