Image Details
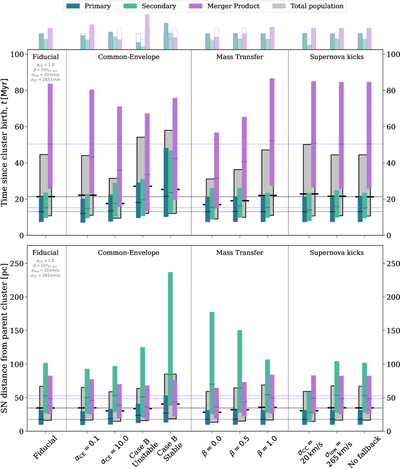
Caption: Figure 4.
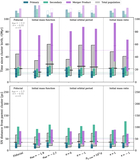
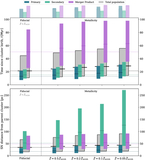
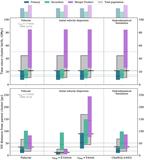
Comparison of the impact of binary physics variations on the timing (top panel) and location (bottom panel) of SNe. Each group of bars in the main panels corresponds to a different choice of binary physics. Colored bars show the interquartile range for each subpopulation (labeled in the legend) with darker lines at the median. The gray bars show the same information for the overall distribution. Full distributions for the fiducial model are shown in Figure 1. Thin horizontal lines indicate the fiducial median values for comparison. Fiducial parameter are annotated in the top-left corner. The small bars at the top indicate the number of SNe per 100 M⊙, with the fiducial values shown in a thin outline. Section 4.2 explains how to interpret this figure (and Figures 5–7) in further detail. An interactive version of this figure (and Figures 5–7) is available. The interactive version allows the reader to focus the plot on specific progenitor types or model variations.
An interactive version of this figure is available in the online article.
An interactive version of this figure is available.
An interactive version of this figure is available in the online journal.
Other Images in This Article
Show More
Copyright and Terms & Conditions
© 2025. The Author(s). Published by the American Astronomical Society.