Image Details
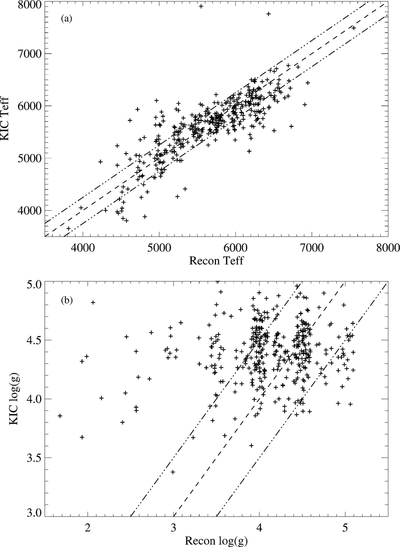
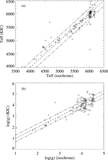
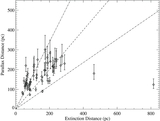
Caption: Figure 9.
Same as the previous figure, except for stars with T eff and log ( g) estimates from matching a grid of models to reconnaissance spectroscopy of Kepler transiting planet candidates. Most plotted points are the average of results from two or more independent spectra. Also, small random offsets have been applied in both axes, to reduce crowding. Diagonal lines indicate equality and ±250 K, ±0.3 dex. The analysis of these spectra provided no metallicity estimates, so log ( Z) is not shown.
Other Images in This Article

Show More
Copyright and Terms & Conditions
© 2011. The American Astronomical Society. All rights reserved.
Copyright ©
2025 Astronomy Image Explorer. All Rights Reserved.