Image Details
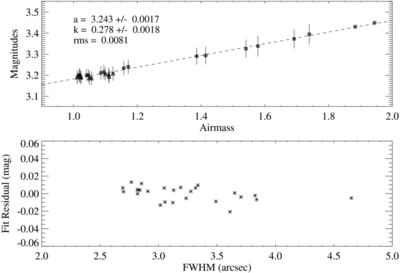
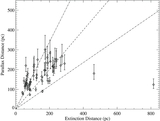
Caption: Figure 2.
Plot of g extinction data on a representative (mildly non-photometric) night. The top panel shows extinction as a function of airmass. Points plotted as diamonds were obtained before the meridian transit of the standard star field; those plotted as triangles were obtained after it. Vertical bars indicate the interquartile spacing of results from the 20 stars used to estimate the extinction. The diagonal dashed line is the result of a robust linear fit to the extinction values, with coefficients tabulated in the upper left corner of the plot. The bottom panel shows residuals around this fit plotted against the time-varying FWHM of the stellar point-spread function.
Other Images in This Article

Show More
Copyright and Terms & Conditions
© 2011. The American Astronomical Society. All rights reserved.