Image Details
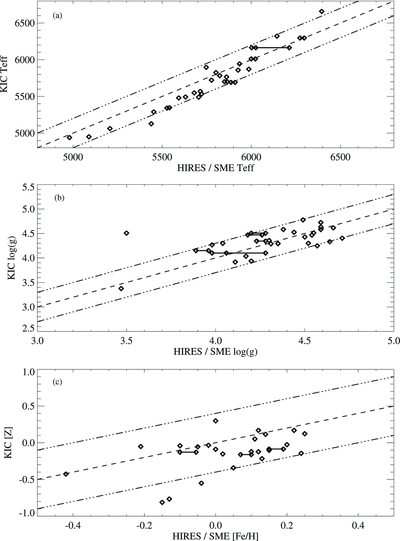
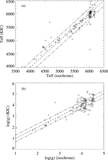
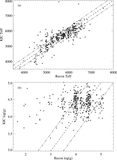
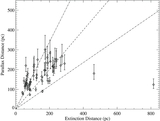
Caption: Figure 8.
Parameter estimates from the KIC plotted against estimates by D. Fischer from SME model spectrum fitting, for stars observed with the Keck/HIRES spectrometer as possible transiting planet hosts. A few stars have more than one independent HIRES/SME observation and analysis; in these cases, the various results are shown connected by horizontal lines. Panel (a) shows T eff on each axis, with lines showing equality and ±200 K overplotted. Panel (b) shows log ( g), with lines showing equality and ±0.3 dex. Panel (c) similarly shows log ( Z), with line showing equality and ±0.4 dex.
Other Images in This Article

Show More
Copyright and Terms & Conditions
© 2011. The American Astronomical Society. All rights reserved.
Copyright ©
2025 Astronomy Image Explorer. All Rights Reserved.