Image Details
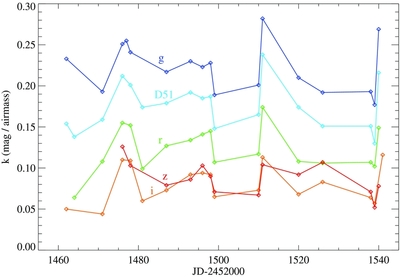
Caption: Figure 3.
Variation in the k i coefficient (extinction per unit airmass in the ith filter), shown as a function of date, for nights for which reliable linear fits to the extinction could be obtained, during a part of one observing season. The time span shown here was one of the most variable that we encountered in five seasons of observing, but is nonetheless typical in its variability within a factor of 1.5. Filters g, D51, r, i, z are shown in order from top to bottom of the plot. Night-to-night variations tend to be not only correlated, but of similar size among the filters. An exception is the z filter, in which the extinction is evidently affected by a different process than at shorter wavelengths. We believe that this process is extinction from water vapor.
Other Images in This Article

Show More
Copyright and Terms & Conditions
© 2011. The American Astronomical Society. All rights reserved.