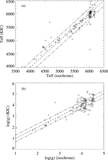
Image Details
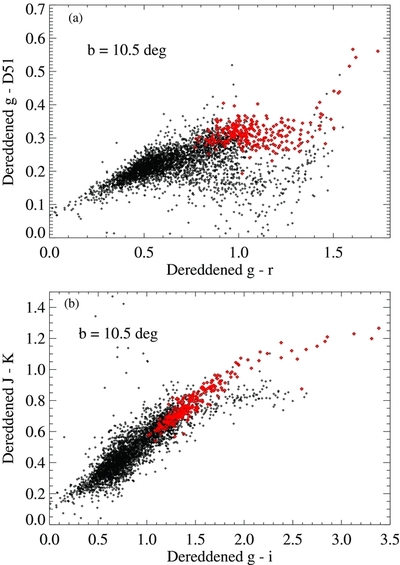
Caption: Figure 6.
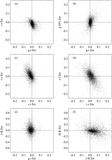
Panel (a) shows the (
g −
D51) vs. (
g −
r) color–color diagram for the same 1-deg-square tile as shown in the previous figure, at galactic latitude
b
![]() 10
10
![]() 5. Stars classified as giants (with log (
g) < 3.6) are indicated by red symbols, and dwarfs (with larger log (
g)) are plotted in black. Panel (b) is similar to the above, but shows a (
J −
K) vs. (
g −
i) color–color diagram for the same tile. The meaning of the symbols is the same.
5. Stars classified as giants (with log (
g) < 3.6) are indicated by red symbols, and dwarfs (with larger log (
g)) are plotted in black. Panel (b) is similar to the above, but shows a (
J −
K) vs. (
g −
i) color–color diagram for the same tile. The meaning of the symbols is the same.
Other Images in This Article

Show More
Copyright and Terms & Conditions
© 2011. The American Astronomical Society. All rights reserved.
Copyright ©
2025 Astronomy Image Explorer. All Rights Reserved.