Image Details
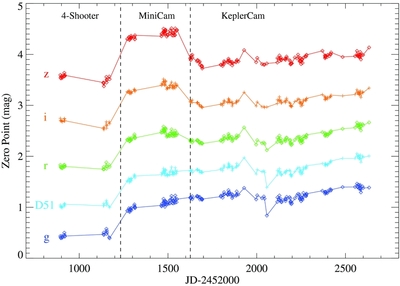
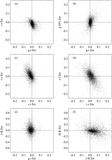
Caption: Figure 1.
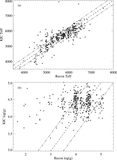
Combined atmospheric and instrumental coefficients a i (see Equation (1)) for the g, D51, r, i, and z filters for 203 of the 205 nights on which KIC data were obtained. The remaining two nights gave values that are extreme outliers, falling outside the range of these plots. Zero points on these curves have been shifted for plotting convenience. Note the color dependence of the temporal variations, which tend to be larger in blue filters than in red. Vertical dashed lines indicate the dates of transition between CCD cameras.
Other Images in This Article
Show More
Copyright and Terms & Conditions
© 2011. The American Astronomical Society. All rights reserved.
Copyright ©
2025 Astronomy Image Explorer. All Rights Reserved.