Image Details
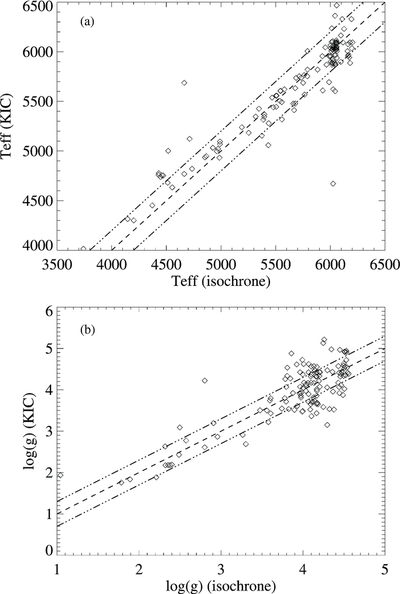
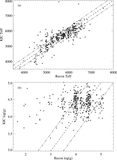
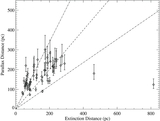
Caption: Figure 7.
Stellar parameter estimates for confirmed single stars in the star cluster M67. Estimates from the KIC are plotted on the y-axis; along the x-axis are values from the 4 Gyr solar-abundance Yonsei–Yale isochrone (Yi et al. 2008), fit to B, V photometry by Montgomery et al. (1993). The diagonal dashed line indicates equality. Panel (a) shows T eff on each axis, with lines showing equality and ±200 K overplotted. Panel (b) similarly shows log ( g), with lines showing equality and ±0.3 dex.
Other Images in This Article

Show More
Copyright and Terms & Conditions
© 2011. The American Astronomical Society. All rights reserved.
Copyright ©
2025 Astronomy Image Explorer. All Rights Reserved.