Image Details
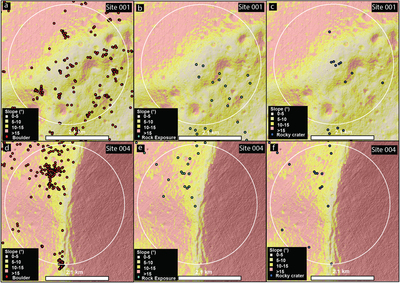
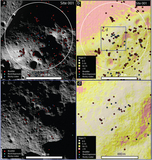
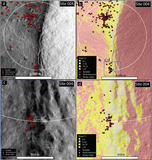
Caption: Figure 7.
2 km exploration zones around sites 001 and 004 shown on LOLA (5 m pixel−1) derived slope maps overlaid on a LOLA derived hillshade. (a)–(c) shows the exploration zone around site 001. Scale bars in all panels are 2.1 km long. (a) Boulder distribution in relation to slopes. (b) Rock exposure distribution in relation to slopes. (c) Rocky craters in relation to slopes. (d)–(f) shows the 2 km ellipse around site 004. (d) Boulder distribution in relation to slopes. (e) Rock exposure distribution in relation to slopes. (f) Rocky craters in relation to slopes.
Other Images in This Article
Copyright and Terms & Conditions
© 2022. The Author(s). Published by the American Astronomical Society.
Copyright ©
2026 Astronomy Image Explorer. All Rights Reserved.