Image Details
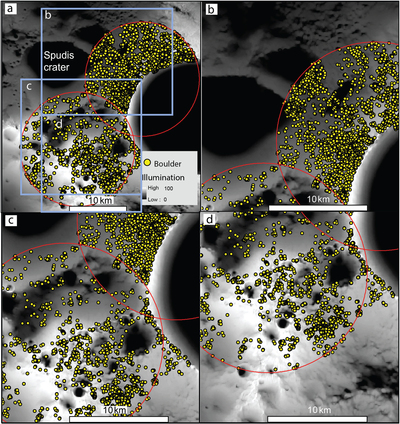
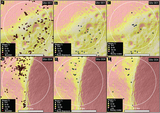
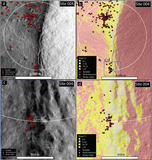
Caption: Figure 5.
Boulder distribution in sunlit regions overlaid on a Wide Angle Camera (WAC) south pole illumination map from Mazarico et al. (2011) (100 m pixel−1). (a) Context figure for (b)–(d). Red circles show the mapped area. Yellow points show the locations of individual boulders, and the blue squares show the locations of (b)–(d). (b) Distribution of boulders near large PSRs to the left of the image just on the edge of the mapping area. Bickel et al. (2021, 2022) found additional boulders in some of those PSRs (not shown here). (c) Boulder distribution across the “Connecting Ridge” area and fewer boulders seen surrounding the PSRs to the top of the image. (d) Boulder distribution to the base of the “Connecting Ridge” slope, more boulders seen surrounding the PSRs that cover crater floors.
Other Images in This Article
Copyright and Terms & Conditions
© 2022. The Author(s). Published by the American Astronomical Society.