Image Details
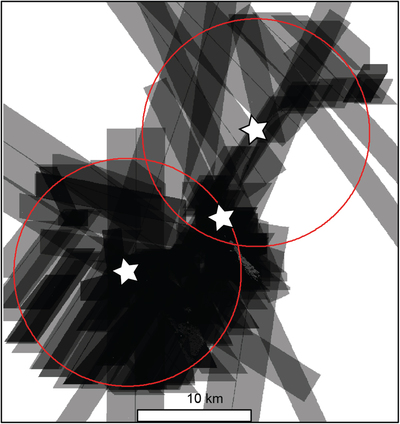
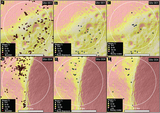
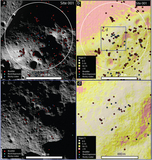
Caption: Figure A1.
NAC image coverage over the mapping area. Red circles show the mapping region, and the gray boxes show the footprints of the 109 NAC images used. Darker areas show where several NACs overlap, covering the same area.
Other Images in This Article
Copyright and Terms & Conditions
© 2022. The Author(s). Published by the American Astronomical Society.
Copyright ©
2026 Astronomy Image Explorer. All Rights Reserved.