Image Details
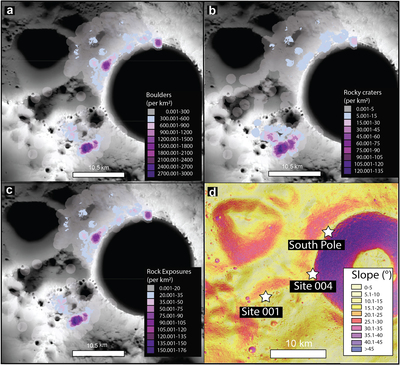
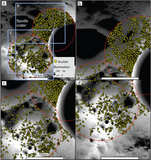
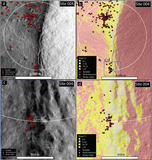
Caption: Figure 2.
Density maps overlain on the illumination map by Mazarico et al. (2011). Density maps were created using a cell size of 100 m and a search radius of 1000 km2. (a) Boulder distribution. (b) Rocky crater distribution (c) Rock exposures distribution. (d) LOLA derived slope map (5 m pixel−1) to compare distribution with.
Other Images in This Article
Copyright and Terms & Conditions
© 2022. The Author(s). Published by the American Astronomical Society.
Copyright ©
2026 Astronomy Image Explorer. All Rights Reserved.