Image Details
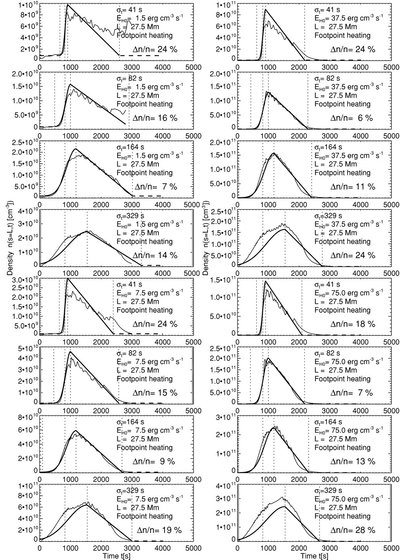
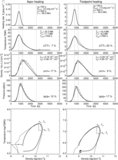
Caption: Figure 9.
Simulated hydrodynamic electron density profiles n( t, s = L) at the loop apex (thin curves) and analytical approximations (thick curves) for the same subset of cases as shown in Figure 8, with similar presentation.
Other Images in This Article

Copyright and Terms & Conditions
© 2009. The American Astronomical Society. All rights reserved.
Copyright ©
2025 Astronomy Image Explorer. All Rights Reserved.