Image Details
Caption: Figure 4.
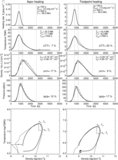
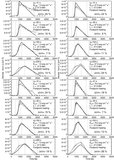
Heating rate E H ( t) is given by a Gaussian function (thin solid curve). The density function n( t) follows the time integral (thick solid curve) of this Gaussian function (for a constant value of dn evap/ dE H ) according to the Neupert effect, which can be approximated by a semi-Gaussian function (dashed curve). The time t m of the maximum heating rate and the time t p of the peak density are indicated with dotted lines.
Other Images in This Article

Copyright and Terms & Conditions
© 2009. The American Astronomical Society. All rights reserved.
Copyright ©
2025 Astronomy Image Explorer. All Rights Reserved.