Image Details
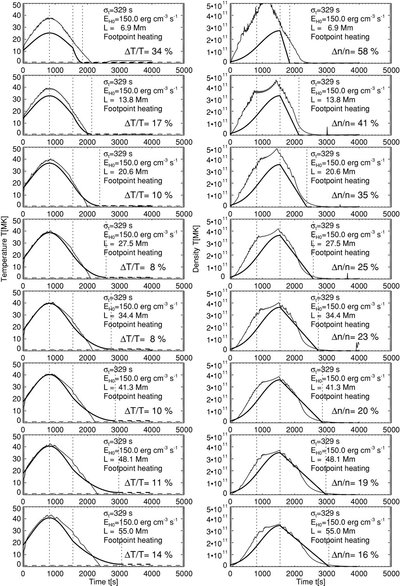
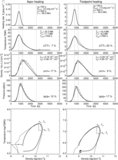
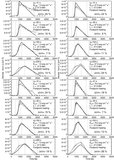
Caption: Figure 10.
Temperature (left) and density profiles (right) for a subset of cases simulated in Tsiklauri et al. (2004) with varying loop lengths, from L = 13.8 Mm (top) to L = 110 Mm (bottom). Major discrepancies are only found for the shortest loops (top).
Other Images in This Article
Copyright and Terms & Conditions
© 2009. The American Astronomical Society. All rights reserved.
Copyright ©
2025 Astronomy Image Explorer. All Rights Reserved.