Image Details
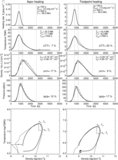
Caption: Figure 8.
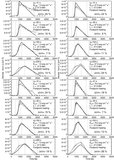
Simulated hydrodynamic temperature profiles T( t, s = L) at the loop apex (thin curves) and analytical approximations (thick curves) for a subset of 56 cases simulated by Tsiklauri et al. (2004). The selected cases include variations of the heating timescale t heat and heating rate E H , for footpoint heating. The average deviations Δ T/ T max between the numerical values and analytical approximations are given in percentages in each frame.
Other Images in This Article

Copyright and Terms & Conditions
© 2009. The American Astronomical Society. All rights reserved.
Copyright ©
2025 Astronomy Image Explorer. All Rights Reserved.