Image Details
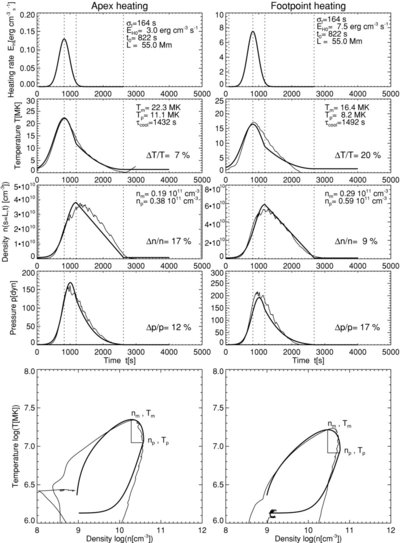
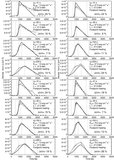
Caption: Figure 7.
Time evolution of heating function E H ( s = L, t) (top panels), temperature T( s = L, t) (second row), density n( s = L, t) (third row), pressure p( s = L, t) (fourth row), and logarithmic temperature–density diagram T( n) (bottom panels) of two hydrodynamic simulations from the set of Tsiklauri et al. (2004), for apex heating (left) and footpoint heating (right). The curves of the hydrodynamic simulations are shown with thin linestyle, while our analytical approximations are indicated with thick linestyle. The start time t s , temperature maximum time t m , density peak time t p , and end time t e are indicated with dotted vertical lines.
Other Images in This Article

Copyright and Terms & Conditions
© 2009. The American Astronomical Society. All rights reserved.