Image Details
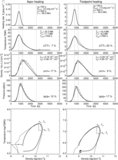
Caption: Figure 1.
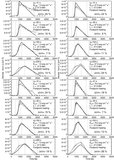
Generic time evolution of temperature T( t) and electron density n( t) during an impulsive heating process with subsequent cooling, subdivided into two time phases of (1) dominant heating ( t s < t < t p ) and (2) dominant cooling ( t p < t < t e ). The maximum of the temperature profile T m = T( t = t m ) occurs at time t m , and the density has a peak value n p = n e ( t = t p ) at time t p , approximately when the temperature drops to half of the maximum value, i.e., T p = T m /2.
Other Images in This Article

Copyright and Terms & Conditions
© 2009. The American Astronomical Society. All rights reserved.