Image Details
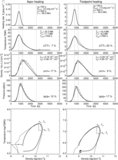
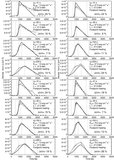
Caption: Figure 6.
Comparison of analytical solutions of the peak density n p = n( s = L, t = t p ) at the loop apex (Equations (45)) with the values obtained from numerical hydrodynamic simulations. The peak density values agree within a few percents for both apex (crosses) and footpoint heating (diamonds).
Other Images in This Article

Copyright and Terms & Conditions
© 2009. The American Astronomical Society. All rights reserved.
Copyright ©
2025 Astronomy Image Explorer. All Rights Reserved.