Image Details
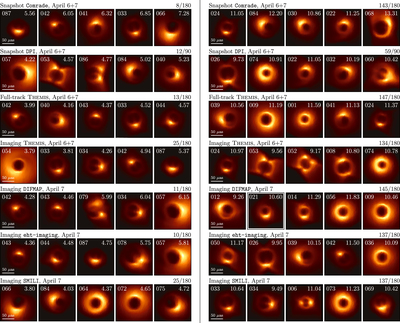
Caption: Figure 35.
Time-averaged images for GRMHD simulations that produce anomalously small (left) and typical (right) α calibrations for each geometric modeling and IDFE method used to estimate the mass of Sgr A*. Left: shown are the GMRHD simulations within the calibration set that result in the five smallest median α values (computed across the applicable posterior or top set). Above each collection of images, the number of calibration data sets that find α < 7.5 is listed, in comparison to the total number of calibration experiments (HI/LO band, REx/VIDA ring radius measurements). Right: five GRMHD simulations randomly chosen from within the peak of the distribution of α values. Above each collection of images, the number of calibration data sets within one standard deviation of the mean α across the calibration set is listed. In each panel, the corresponding simulation index in Table 7 and the median α across the relevant posterior or top set are given in the upper left and right, respectively.
Other Images in This Article


Show More
Copyright and Terms & Conditions
© 2022. The Author(s). Published by the American Astronomical Society.