Image Details
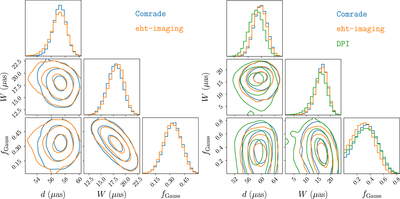
Caption: Figure 33.
Comparison of the 2D joint posterior distributions obtained from fitting an mG-ring model to a 120 s snapshot starting at 12.65 hr UT in the Sgr A* April 7 HOPS low-band data set. The left plot compares the results from Comrade (blue) and eht-imaging (orange), fitting to visibility amplitudes (including gains) and closure phases with an m = 3 mG-ring. The right triangle plot shows the results from Comrade (blue), eht-imaging (orange), and DPI (green), fitting to closure amplitudes and closure phases for an m = 2 mG-ring. In both cases we only show the results for the diameter, width, and fractional Gaussian component flux parameters. Since DPI fits the diameter of the blurred m-ring ﹩d^{\prime} ﹩ (Equation (42)), the DPI diameter was debiased so that it corresponds to the infinitesimally thin m-ring diameter that is fit by eht-imaging and Comrade (see also M87* Paper VI). The contours show 1σ, 2σ, and 3σ levels of the posterior distributions.
Other Images in This Article


Show More
Copyright and Terms & Conditions
© 2022. The Author(s). Published by the American Astronomical Society.