Image Details
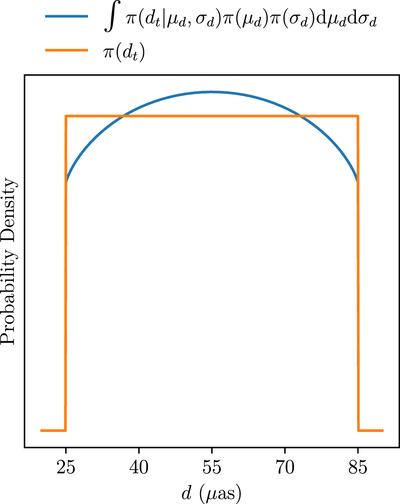
Caption: Figure 32.
Illustration of the centralizing bias induced by specifying both the snapshot priors and hypermodel priors separately, using the diameter parameter as an example. The orange curve shows the diameter prior specified during mG-ring model fitting of an individual snapshot, and the blue curve shows the effective prior on this parameter after snapshots are combined via the procedure specified in Section 6.3.
Other Images in This Article


Show More
Copyright and Terms & Conditions
© 2022. The Author(s). Published by the American Astronomical Society.
Copyright ©
2025 Astronomy Image Explorer. All Rights Reserved.