Image Details
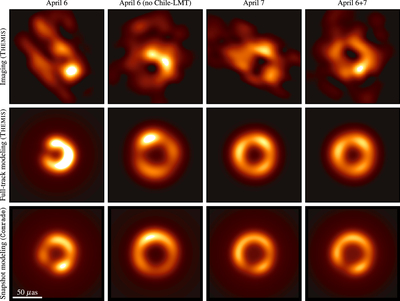
Caption: Figure 27.
Comparison of the results from THEMIS imaging (top row), full-track geometric modeling (middle row), and snapshot modeling (bottom row) across different combinations of April 6 and 7 data sets. The first column shows results from fitting to the April 6 data, the second column shows results from fitting to the April 6 data after flagging baselines between Chile and LMT, the third column shows results from fitting to the April 7 data, and the fourth column shows results from fitting to the combined April 6 and 7 data. In all panels, we show an image corresponding to the posterior mean; for the THEMIS imaging results, each sample image has been shifted during averaging so as to maximize the normalized cross-correlation computed with respect to a reference sample. The full-track and snapshot modeling results show fits to the HOPS pipeline low-band data, while the imaging results show fits to the HOPS pipeline combined low- and high-band data. All of the images share a common brightness color scale; the absolute brightness scale is arbitrary because each image has been normalized to have unit total flux density, and a modest amount of saturation has been permitted in the brightest regions to enhance the visibility of low-brightness features.
Other Images in This Article


Show More
Copyright and Terms & Conditions
© 2022. The Author(s). Published by the American Astronomical Society.