Image Details
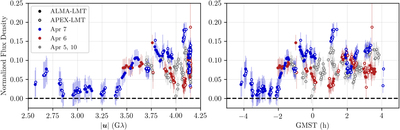
Caption: Figure 24.
Visibility amplitudes from the HOPS low-band Sgr A* data set, averaged coherently over 120 s segments, on Apr 6 (red), April 7 (blue), and April 5 and 10 (gray) on the Chile-LMT baselines as functions of baseline length (left) and observing time (right). Error bars indicate the error implied by the mean noise model and are intended to account for fluctuations due to variability in addition to statistical and known systematic error components.
Other Images in This Article


Show More
Copyright and Terms & Conditions
© 2022. The Author(s). Published by the American Astronomical Society.
Copyright ©
2025 Astronomy Image Explorer. All Rights Reserved.