Image Details
Caption: Figure 23.
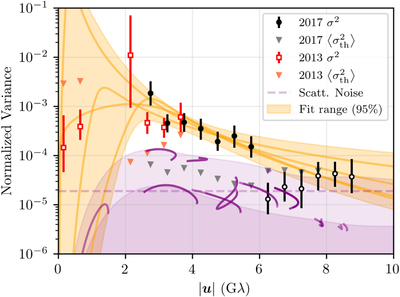
Estimate of the variance of the visibility amplitudes from the 2013 1.3 mm VLBI observations reported in Johnson et al. (2015), indicated by the red open circles. The associated statistical errors are shown by the red triangles. For comparison, all of the elements of Figure 4 are reproduced as shown there, including the 2017 EHT variance estimates (filled and open black circles).
Other Images in This Article


Show More
Copyright and Terms & Conditions
© 2022. The Author(s). Published by the American Astronomical Society.
Copyright ©
2025 Astronomy Image Explorer. All Rights Reserved.