Image Details
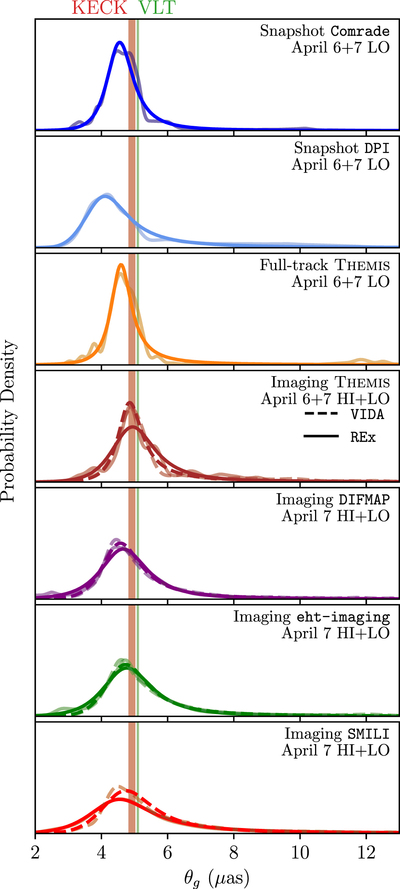
Caption: Figure 22.
Sgr A* θ g distributions for all of the analyses in this paper. The solid color curves show the fitted generalized lambda distribution. The transparent curves show the kernel density estimate for the distribution. The plotted results have been obtained using the HOPS calibration pipeline. For reference, we overlay the θ g constraints measured from stellar orbits with the Keck (Do et al. 2019) and Very Large Telescope (VLT; Gravity Collaboration et al. 2019, 2020) facilities.
Other Images in This Article


Show More
Copyright and Terms & Conditions
© 2022. The Author(s). Published by the American Astronomical Society.