Image Details
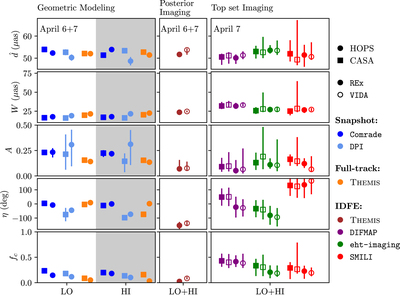
Caption: Figure 21.
Morphological parameters measured from Sgr A* data using the geometric modeling (left columns), posterior imaging IDFE (middle column), and top-set imaging IDFE (right columns) analyses; each marker denotes a median value, and the error bars indicate 68% credible intervals. For geometric and posterior imaging we show the combined April 6 and 7 results, while for top-set imaging we show just descattered April 7. Each row of panels shows the results for a single morphological parameter, with the markers colored according to the method used to make the measurement (per the legend on the right). Measurements made using Sgr A* data from both calibration pipelines are shown using circular and square markers for HOPS and CASA, respectively. IDFE measurements made using REx and VIDA are indicated by filled and open markers, respectively; no metronization cuts have been applied to either top-set or posterior images. The IDFE analyses have been applied to images reconstructed using both frequency bands simultaneously (LO+HI), while the geometric modeling analyses have been applied to each frequency band separately (LO and HI).
Other Images in This Article


Show More
Copyright and Terms & Conditions
© 2022. The Author(s). Published by the American Astronomical Society.