Image Details
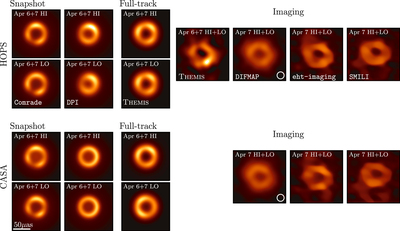
Caption: Figure 20.
Mean images for each geometric modeling and image reconstruction pipelines applied to the Sgr A* data, showing both low band and high band separately for the geometric modeling and the combined bands for image reconstruction (from Paper III). The geometric modeling and THEMIS imaging pipelines have been applied to the combined April 6 and 7 data, while the DIFMAP, eht-imaging, and SMILI imaging pipelines have been applied to the April 7 descattered data; Figures 28 and 29 show single-day results for all pipelines on April 6 and 7, respectively. The upper group of images have been produced from the HOPS calibration pipeline Sgr A* data, while the bottom group of images correspond to the CASA calibration pipeline. All of the images share a common brightness color scale; the absolute brightness scale is arbitrary because each image has been normalized to have unit total flux density.
Other Images in This Article


Show More
Copyright and Terms & Conditions
© 2022. The Author(s). Published by the American Astronomical Society.