Image Details
Caption: Figure 18.
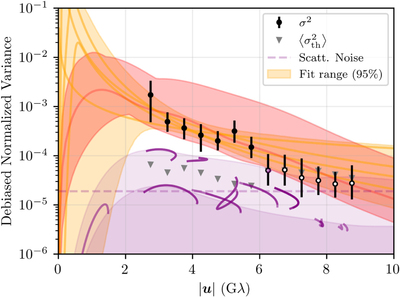
Similar to Figure 4, but after the direct visibility estimates have been debiased to account for the short-time temporal correlations as described in Broderick et al. (2022). These estimates are directly comparable to the power spectra implied by GRMHD simulations (Georgiev et al. 2022). A single example and the range associated with the library presented in Paper V are shown by the red line and band, respectively.
Other Images in This Article


Show More
Copyright and Terms & Conditions
© 2022. The Author(s). Published by the American Astronomical Society.
Copyright ©
2025 Astronomy Image Explorer. All Rights Reserved.