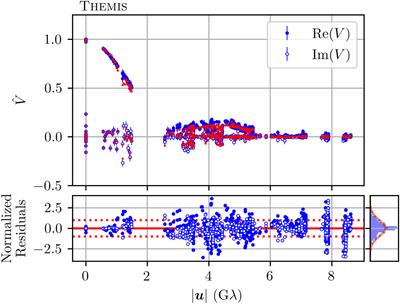
Results of full-track modeling using an m = 4 mG-ring fit to the Sgr A* HOPS low-band data on April 6 and 7, arranged analogously to the individual panels of Figure 9. As in Figure 9, ﹩\displaystyle \hat{V}﹩ denotes light-curve-normalized complex visibilities.