Image Details
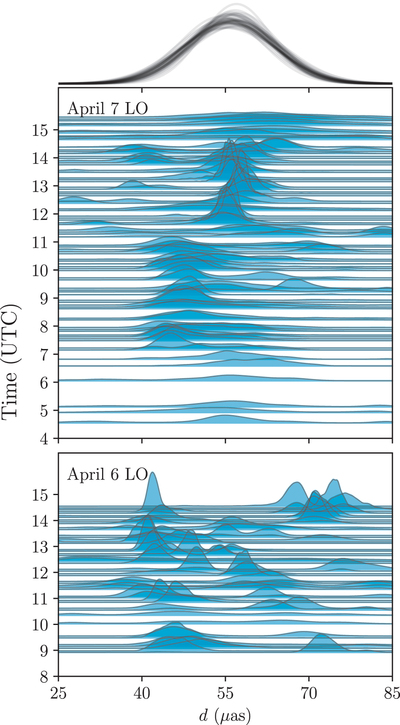
Caption: Figure 13.
Example snapshot modeling results and averaging scheme applied to the Sgr A* April 6 and 7 low-band HOPS data sets. The blue filled regions show the posterior distribution of the mG-ring diameter parameter for an m = 4 model fit to each 120 s snapshot. We find the tightest diameter posteriors from 12.5 to 14 UTC, which corresponds to the best time region from Paper III. For visual clarity we only show the distributions for every second snapshot. The black curves at the top show the diameter distribution corresponding to 100 random draws from the hypermodel posterior (Equation (36)).
Other Images in This Article


Show More
Copyright and Terms & Conditions
© 2022. The Author(s). Published by the American Astronomical Society.
Copyright ©
2025 Astronomy Image Explorer. All Rights Reserved.