Image Details
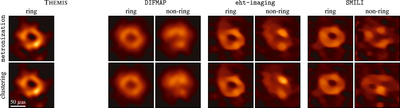
Caption: Figure 11.
Comparison of two ring classification procedures. Each panel shows a mean Sgr A* ring and nonring image for a single imaging pipeline, with the top row showing how the images are classified by metronization in the “permissive” mode and the bottom row showing the classification determined by the clustering analysis from Paper III. All of the images have been produced using descattered Sgr A* data from the HOPS calibration pipeline. The results correspond to combined April 6 and 7 data for posterior imaging and April 7 data for top-set imaging. All of the images share a common brightness color scale; the absolute brightness scale is arbitrary because each image has been normalized to have unit total flux density.
Other Images in This Article


Show More
Copyright and Terms & Conditions
© 2022. The Author(s). Published by the American Astronomical Society.