

Image Details
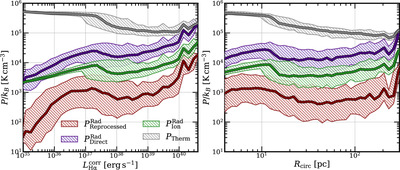
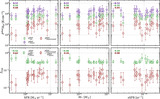
Caption: Figure 9.
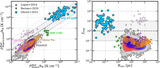
Here we compare ﹩{P}_{{\rm{Reprocessed}}}^{{\rm{Rad}}}﹩ (maroon), ﹩{P}_{{\rm{Direct}}}^{{\rm{Rad}}}﹩ (navy), ﹩{P}_{{\rm{Ion}}}^{{\rm{Rad}}}﹩ (green), and the Strömgren PTherm (gray) for the full sample of H II regions. The hatched regions show the 16th–84th percentiles, and the solid lines show the median of each radiation pressure term. Variation of the pressures with ﹩{L}_{{\rm{H}}\alpha }^{{\rm{corr}}}﹩ (left panel) and Rcirc (right panel) for each region is included for comparison.
Other Images in This Article

Show More
Copyright and Terms & Conditions
© 2025. The Author(s). Published by the American Astronomical Society.

Copyright ©
2026 Astronomy Image Explorer. All Rights Reserved.
