

Image Details
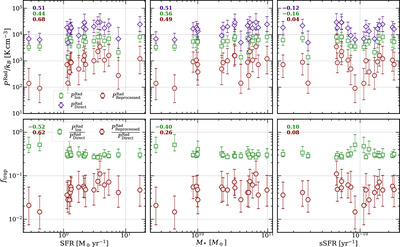
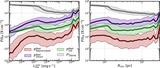
Caption: Figure 10.
Here we compare the median﹩{P}_{{\rm{Reprocessed}}}^{{\rm{Rad}}}﹩ (maroon hexagons), ﹩{P}_{{\rm{Direct}}}^{{\rm{Rad}}}﹩ (blue diamonds), and ﹩{P}_{{\rm{Ion}}}^{{\rm{Rad}}}﹩ (green squares; top row), and ﹩{f}_{{\rm{trap}}}={P}_{{\rm{Reprocessed}}}^{{\rm{Rad}}}/{P}_{{\rm{Direct}}}^{{\rm{Rad}}}﹩ (maroon hexagons) and ﹩{P}_{{\rm{Ion}}}^{{\rm{Rad}}}/{P}_{{\rm{Direct}}}^{{\rm{Rad}}}﹩ (green squares; bottom row) with the average star formation rate (SFR), total stellar mass (M*), and specific star formation rate (sSFR) for all 19 galaxies. Each marker shows the median for each galaxy, and the error bars denote the 16th–84th percentile range in values. The Spearman rank coefficient ρ for the correlation between each median and galaxy property is noted in the top left of each panel.
Other Images in This Article

Show More
Copyright and Terms & Conditions
© 2025. The Author(s). Published by the American Astronomical Society.

