

Image Details
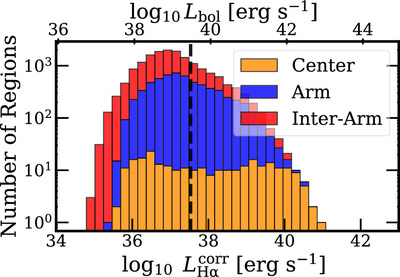
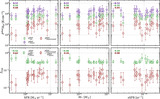
Caption: Figure 6.
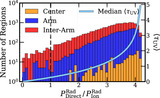
The distribution of attenuation-corrected ﹩{L}_{{\rm{H}}\alpha }^{{\rm{corr}}}﹩. The alternate x-axis shows the corresponding Lbol estimated by assuming the average ﹩{L}_{{\rm{bol}}}/{L}_{{\rm{H}}\alpha }^{{\rm{corr}}}﹩ ratio as described in Section 2.3 The vertical dashed line indicates the luminosity of a 1000 M⊙ SSP at the average age of our adopted model.
Other Images in This Article

Show More
Copyright and Terms & Conditions
© 2025. The Author(s). Published by the American Astronomical Society.

Copyright ©
2026 Astronomy Image Explorer. All Rights Reserved.
