

Image Details
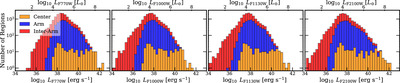
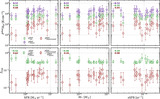
Caption: Figure 2.
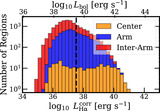
The distribution of filter-integrated luminosities LFX = ΔλFXLλ,FX for our sample of H II regions. We separate the regions by environment following M. Querejeta et al. (2021) and plot distributions for galactic centers (yellow), spiral arms and bars (blue), and inter-arm regions (red) separately. The panels show results for the four JWST-MIRI filters (FX) that we use—F770W, F1000W, F1130W, and F2100W.
Other Images in This Article

Show More
Copyright and Terms & Conditions
© 2025. The Author(s). Published by the American Astronomical Society.

Copyright ©
2026 Astronomy Image Explorer. All Rights Reserved.
