

Image Details
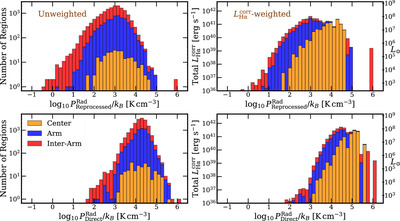
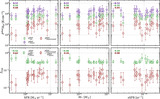
Caption: Figure 5.
Distribution of total IR ﹩\mathrm{log}{P}_{\mathrm{Reprocessed}}^{\mathrm{Rad}}/{k}_{{\rm{B}}}﹩ (top) and UV-optical ﹩\mathrm{log}{P}_{\mathrm{Direct}}^{\mathrm{Rad}}/{k}_{{\rm{B}}}﹩ (bottom). Regions are again split by local environment—galactic centers (yellow), spiral arms and bars (blue), and inter-arm regions (red). The left panel treats each region equally, while the right panel weights regions by their ﹩{L}_{{\rm{H}}\alpha }^{{\rm{corr}}}﹩, similar to the right panel in Figure 3.
Other Images in This Article

Show More
Copyright and Terms & Conditions
© 2025. The Author(s). Published by the American Astronomical Society.

Copyright ©
2026 Astronomy Image Explorer. All Rights Reserved.
