

Image Details
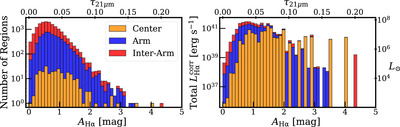
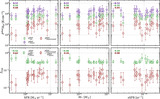
Caption: Figure 3.
Left panel: the distribution of Hα attenuation, AHα, from VLT-MUSE (Section 2.1) in our sample of H II regions, colored by local environment as in Figure 2. The corresponding optical depth at 21 μm, τ21μm, converted from AHα using the G23 extinction law (Table 2), is included as an alternate x-axis. Right panel: corresponding ﹩{L}_{{\rm{H}}\alpha }^{{\rm{corr}}}﹩-weighted histograms, capturing how the Hα luminosity is distributed across regions of different attenuation.
Other Images in This Article

Show More
Copyright and Terms & Conditions
© 2025. The Author(s). Published by the American Astronomical Society.

Copyright ©
2026 Astronomy Image Explorer. All Rights Reserved.
