

Image Details
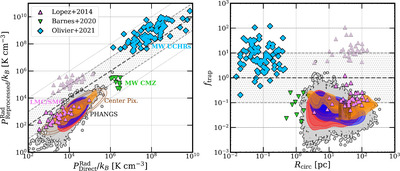
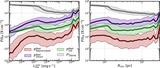
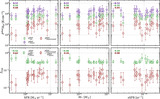
Caption: Figure 8.
Left panel: ﹩{P}_{{\rm{Reprocessed}}}^{{\rm{Rad}}}﹩ and ﹩{P}_{{\rm{Direct}}}^{{\rm{Rad}}}﹩ for our ∼18,000 H II regions and literature measurements. Our individual regions are shown as gray points, and density contours represent the 16th–25th–50th–75th–84th percentile distributions colored by galactic environment—centers (yellow), spiral arms and bars (blue), and inter-arm regions (red). Brown contours show the data density for pixel-scale measurement in galactic centers (Section 2.3). Data from L. A. Lopez et al. (2014; LMC/SMC, purple triangles), G. M. Olivier et al. (2021; UCHRs, cyan diamonds), and A. T. Barnes et al. (2020; Milky Way CMZ, green triangles) is included for comparison. The original data from L. A. Lopez et al. (2014) appear as faint triangles, and bold triangles show their measurements after correcting for IR and UV optical depths (see Section 4). Right panel: similar to the left panel, now showing the variation in ﹩{f}_{{\rm{trap}}}={P}_{{\rm{Reprocessed}}}^{{\rm{Rad}}}/{P}_{{\rm{Direct}}}^{{\rm{Rad}}}﹩ as a function of region radius, Rcirc. The gray shaded region shows where the direct and reprocessed radiation pressure are within 1 dex of each other, around the dashed gray 1:1 line.
Other Images in This Article

Show More
Copyright and Terms & Conditions
© 2025. The Author(s). Published by the American Astronomical Society.

