

Image Details
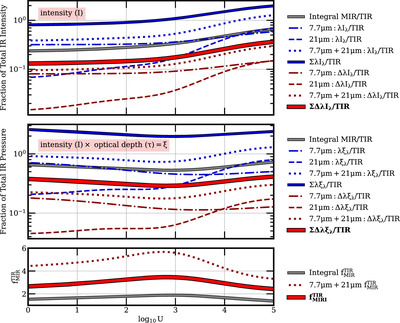
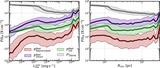
Caption: Figure 15.
Top panel: the fraction of total IR intensity (or flux) (TIR﹩={\int }_{1\,\mu {\rm{m}}}^{1000\,\mu {\rm{m}}}{I}_{\lambda }d\lambda ﹩) captured by different approximations and linear combinations of MIRI filters at a range of U. First, we present the fraction of TIR flux captured by the λIλ approximation in the 7.7 μm filter (blue dotted–dashed), 21 μm filter (blue dashed), 7.7 μm + 21 μm filters (blue dotted), and all four MIRI filters (solid blue). Next, using the filter width Δλ for each MIRI filter, we present the fraction captured by ΔλIλ in the 7.7 μm filter (red dotted–dashed), 21 μm (red dashed), 7.7 μm + 21 μm filters (red dotted), and adding all four MIRI filters (solid red). Finally, we present the fraction of flux captured in the mid-IR by an integral over the model dust SED as ﹩{\int }_{1\mu {\rm{m}}}^{25\mu {\rm{m}}}{I}_{\lambda }d\lambda /{\int }_{1\mu {\rm{m}}}^{1000\mu {\rm{m}}}{I}_{\lambda }d\lambda ﹩ (solid gray). Middle panel: similar to the top panel, now for opacity-weighted intensity (proxy for pressure) ξλ instead of intensity Iλ. Bottom panel: inverting the fractions in the middle panel provides the mid-IR to TIR correction factor ﹩{f}_{\xi }^{{\rm{TIR}}}﹩ at a given U. The correction factor from integrating the model SED (solid gray), adding up all four MIRI filters (solid red), and 7.7 μm + 21 μm filters (red dotted) is included for comparison. The MIRI-estimated ﹩{f}_{\xi }^{{\rm{TIR}}}﹩ using all four filters (solid red) is used for all ﹩{P}_{{\rm{Reprocessed}}}^{{\rm{Rad}}}﹩ calculations.
Other Images in This Article

Show More
Copyright and Terms & Conditions
© 2025. The Author(s). Published by the American Astronomical Society.

