

Image Details
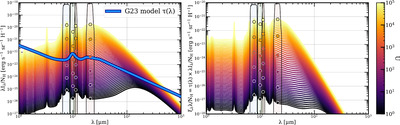
Caption: Figure 14.
Standard HD23 dust models at different radiation fields U. The G23 extinction curve (arbitrary normalization, for visualization only), and the MIRI filter throughputs (arbitrary normalization) at F770W, F1000W, F1130W, and F2100W are included. The left panel shows the variation in intensity λIλ with wavelength and U, showing how the SED of dust emission changes with radiation field. The right panel shows how the shape of the optical depth-weighted intensity, λξλ = τ(λ)λIλ, which is a proxy for pressure contribution, varies with U. Hexagonal points represent the shape of the measured SED by showing the model SED convolved with each of the four MIRI bandpasses, at U = 1, 10, 102, 103, 104, and 105.
Other Images in This Article

Show More
Copyright and Terms & Conditions
© 2025. The Author(s). Published by the American Astronomical Society.

