

Image Details
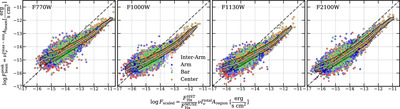
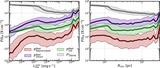
Caption: Figure 13.
Comparing two methods for re-scaling MIRI fluxes from MUSE regions to HST for the ∼7000 H II regions with full HST, MUSE, and JWST-MIRI coverage, colored by local environment. The x-axis scales MIRI fluxes directly by the same proportion that MUSE Hα fluxes are scaled relative to HST Hα fluxes. The y-axis calculates the total flux associated with a point source with peak intensity corresponding to the brightest pixel in each region, with a local background subtraction in each region, at ﹩0\mathop{.}\limits^{^{\prime\prime} }9﹩ resolution.
Other Images in This Article

Show More
Copyright and Terms & Conditions
© 2025. The Author(s). Published by the American Astronomical Society.

Copyright ©
2026 Astronomy Image Explorer. All Rights Reserved.
