

Image Details
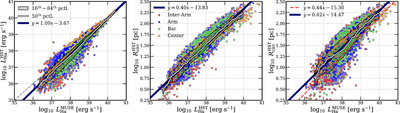
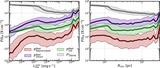
Caption: Figure 12.
Correlations between (left panel) Hα luminosity in erg s−1, as measured by MUSE and HST, (center panel) HST size and HST Hα luminosity from A. Barnes et al. (2025, in preparation), and (right panel) the closure relation between MUSE luminosities and HST sizes. All panels show the 7082 H II regions with joint HST and MUSE coverage. Individual regions are colored by their local environment—galactic centers (yellow), bars (green), spiral arms (blue), and inter-arm regions or the disk (red). The solid white line traces the 50th percentile in y for each bin along the x-axis, and the 16th–84th percentile scatter in each bin is indicated with black hatches. Finally, the best-fit log–log correlation is shown in dark blue, which follows the 50th percentile relation very closely. The gray dashed line indicates the 1:1 line in the left panel, and the red dashed line in the right panel shows the convolution of Equations (A1) and (A3).
Other Images in This Article

Show More
Copyright and Terms & Conditions
© 2025. The Author(s). Published by the American Astronomical Society.

