

Image Details
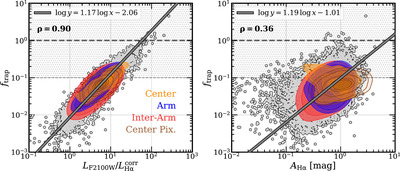
Caption: Figure 11.
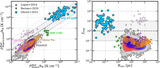
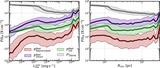
Variation in ftrap as a function of ﹩{L}_{{\rm{F2100W}}}/{L}_{{\rm{H}}\alpha }^{{\rm{corr}}}﹩, which roughly captures the shape of the SED (left panel) and attenuation AHα, with corresponding ﹩\mathrm{log}\unicode{8210}\mathrm{log}﹩ bisector fits (solid black line). Individual regions are shown as gray background points, and density contours represent the 16th–25th–50th–75th–84th percentile distributions colored by local environment—galaxy centers (yellow), spiral arms (blue), inter-arm regions (red). Brown contours show the distribution of ﹩0\mathop{.}\limits^{^{\prime\prime} }9﹩ pixel-scale MUSE estimates in galaxy centers. ftrap shows a tight empirical correlation with ﹩{L}_{{\rm{F2100W}}}/{L}_{{\rm{H}}\alpha }^{{\rm{corr}}}﹩, and shows much more scatter with attenuation. The gray shaded area shows the region where the direct and reprocessed radiation pressure terms are within 1 dex of each other, around the dashed gray line where ftrap = 1. The Spearman rank coefficient ρ for the full sample of regions is included.
Other Images in This Article

Show More
Copyright and Terms & Conditions
© 2025. The Author(s). Published by the American Astronomical Society.

